Evaluate Trained Models
Model evaluations show:
- A production metrics explorer, which helps you find the optimal confidence threshold at which to run your model;
- Model improvement recommendations, which provide suggestions on how you can increase the accuracy of your model;
- Performance by class, which shows how well your model identifies different classes;
- A confusion matrix, which you can use to find specific classes on which your model thrives and struggles;
- An interactive vector explorer which lets you identify clusters of images where your model does well or poorly.
You can use model evaluation to identify areas of improvement for your model.
Model evaluations are automatically run for all versioned models trained on, or uploaded to Roboflow by paid users. It may take several minutes for an evaluation to run for a dataset of a few hundred images, and several hours for large datasets with thousands or more images.
Open Model Evaluation
To find the confusion matrix and vector explorer for your model, open any trained model version in your project. Then, click the "View Evaluation" button.
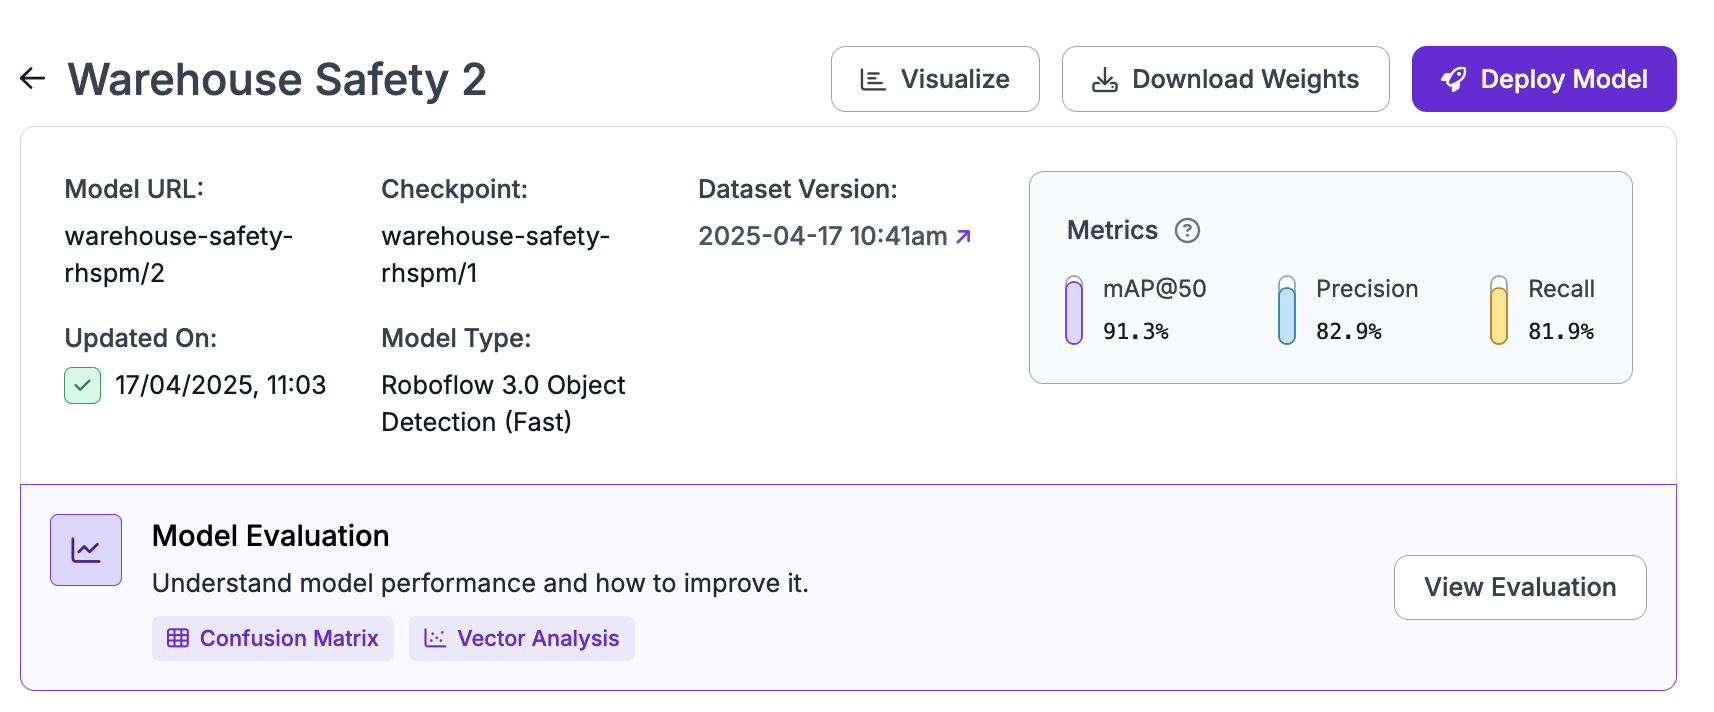
A window will open where you can view your confusion matrix and vector analysis.
Production Metrics Explorer
The production metrics explorer shows the Precision, Recall, and F1 score for your model at all possible confidence thresholds. This information is presented on a graph.
Using these statistics, the production metrics explorer will recommend an "optimal confidence". This is the threshold that will give you the best Precision/Recall/F1 Score trade-off.
You can use this tool to help inform the confidence threshold you set for your model in production.
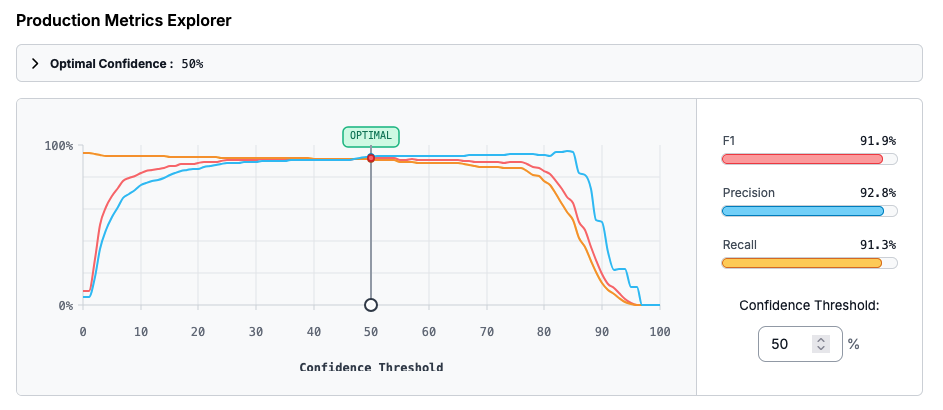
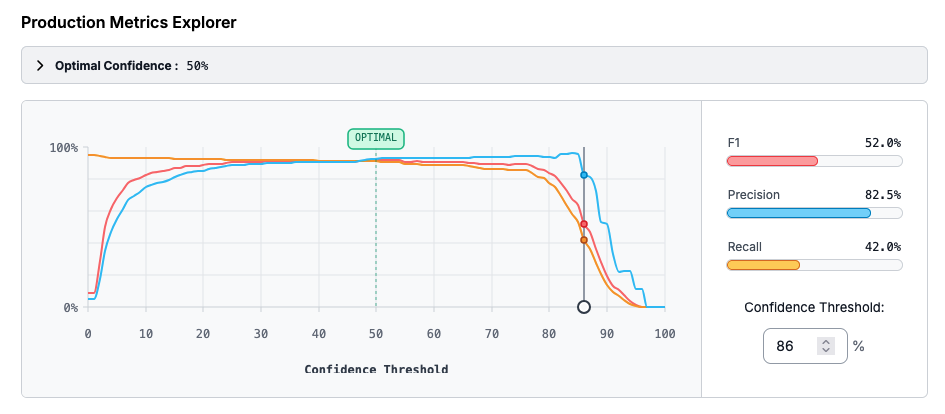
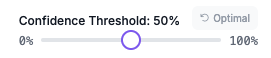
You can drag the slider to see the F1/Precision/Recall values at different confidence thresholds.
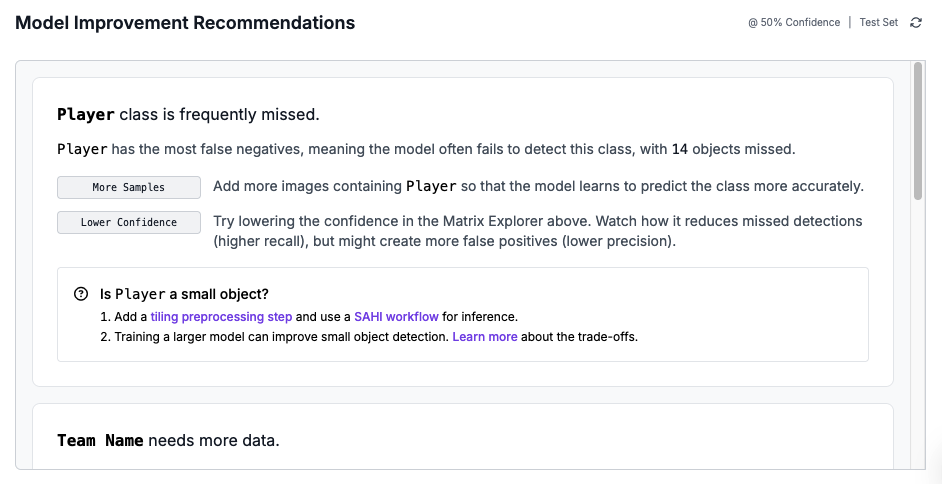
Model Improvement Recommendations
The model improvement recommendations section of your model evaluation lists suggestions on how you can increase the accuracy of your model. These improvements are based on the results of the confusion matrix calculated with your model.
The model improvement recommendations feature can make suggestions related to:
- How to improve a model that predicts many false negatives.
- How to improve a model that predicts many false positives.
- What classes are often confused (mis-identified).
- What classes need more data to improve accuracy.
- When a test or validation set may be too small.
- And more.
Performance by Class
The performance by class chart shows how many correct predictions, misclassifications, false negatives, and false positives there are across all classes in your dataset.
You can use this information to see, at a glance, which classes your model can identify well and the classes your model struggles to identify.
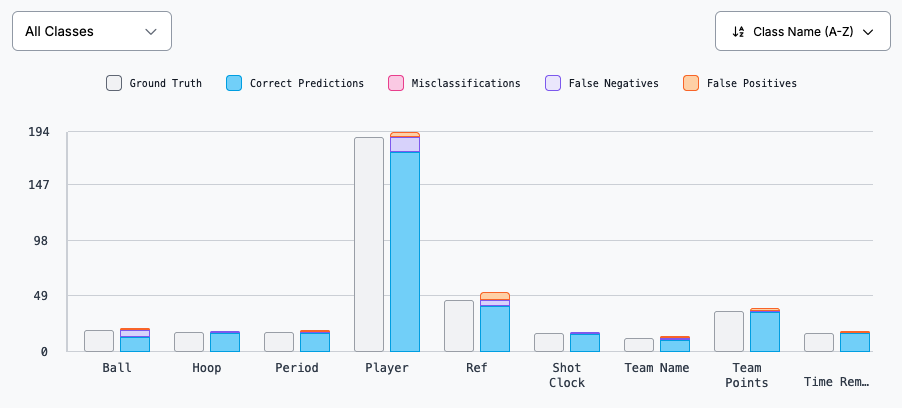
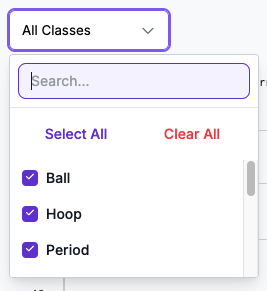
If your dataset has a large number of classes, you can focus the chart on specific classes by opening the "All Classes" dropdown and selecting the classes you want to highlight.
You can also see how this chart changes at different confidence thresholds by moving the Confidence Threshold slider.
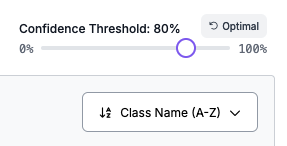
By default, this chart will use the optimal confidence threshold we recommend.
Confusion Matrix
Your confusion matrix shows how well your model performs on different classes.
Your confusion matrix is calculated by running images from your test and validation sets with your trained model. The results from your model are then compared with the "ground truth" from your dataset annotations.
With the confusion matrix tool, you can identify:
- Classes where your model performs well.
- Classes where your model identifies the wrong class for an object (false positives).
- Instances where your model identifies an object where none is present (false negatives).
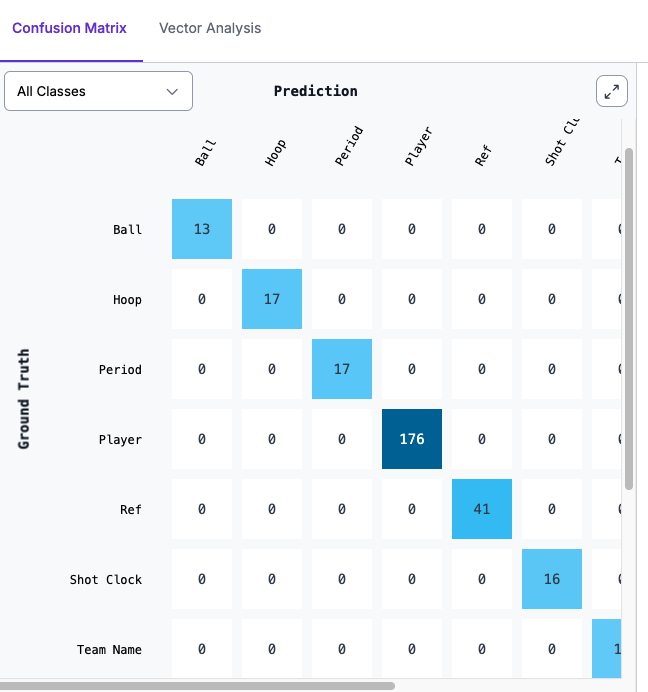
If your model detects many classes, scroll bars will appear that let you navigate your confusion matrix.
By default, the confusion matrix shows how your model performs when run at the optimal threshold calculated for your model.
You can adjust the confidence threshold using the Confidence Threshold slider. Your confusion matrix, precision, and recall will update as you configure the slider.
You can click on each box in the confusion matrix to see what images appear in the corresponding category.
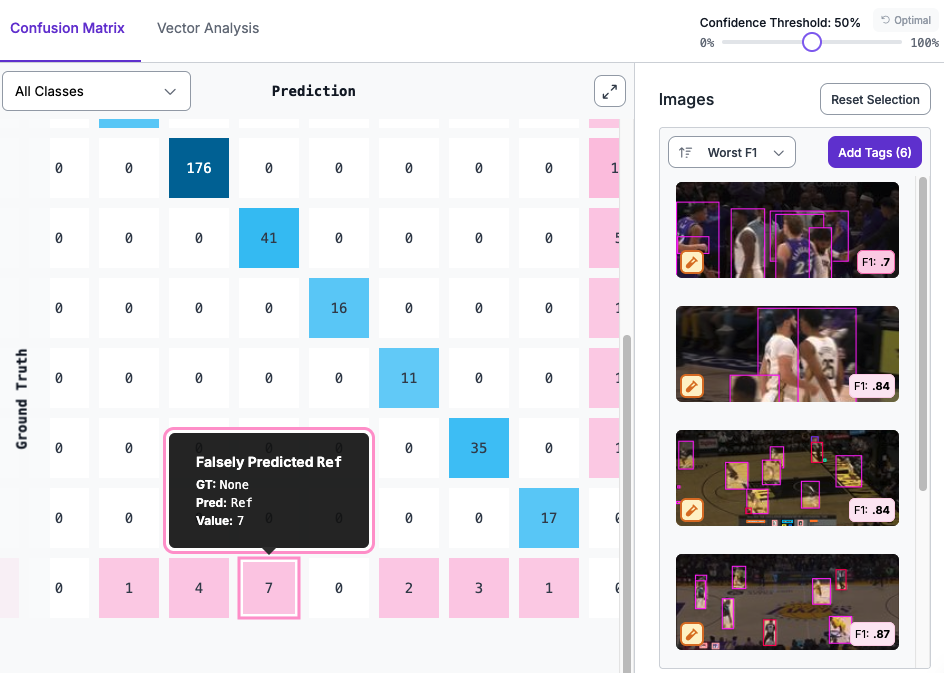
You can click on an individual image to enter an interactive view where you can toggle between the ground truth (your annotations) and the model predictions.

Click "Ground Truth" to see your annotations and "Model Predictions" to see what your model returned.